
Repository
https://github.com/ajayyy/LakeEffectScoutingSummary/
What is this
This is a scouting app developed for FIRST Robotics Team 2708. It is used to scout other robots at the competition. The data is sent from 6 client apps to the server over bluetooth throughout the course of the events. The server must manage and put everything together. Scouting is nessesary to be able to change your team's strategy and know what teams to pick to join your alliance.
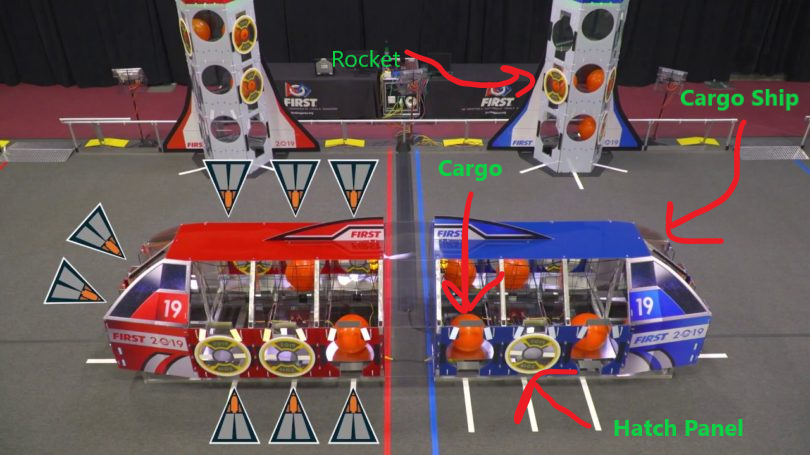
About this year's game
In this years game, teams must score "cargo" into holes in rockets. If the cargo is put in without a hatch panel, then it will fall out. The hatch panels must be fastened on to the rockets and cargo ship to prevent the cargo from falling out.
Reader program for the raw scouting data
The data outputed by the scouting app is very hard to quickly parse. Because of this, I have built a program to make a quick summary of the important detail.
This program parses through the spreadsheet files and makes a nicer to view output. It also allows you to view a photo of the robot.
Technology Stack
This is build in HTML, CSS, and JavaScript using Electron.
Features
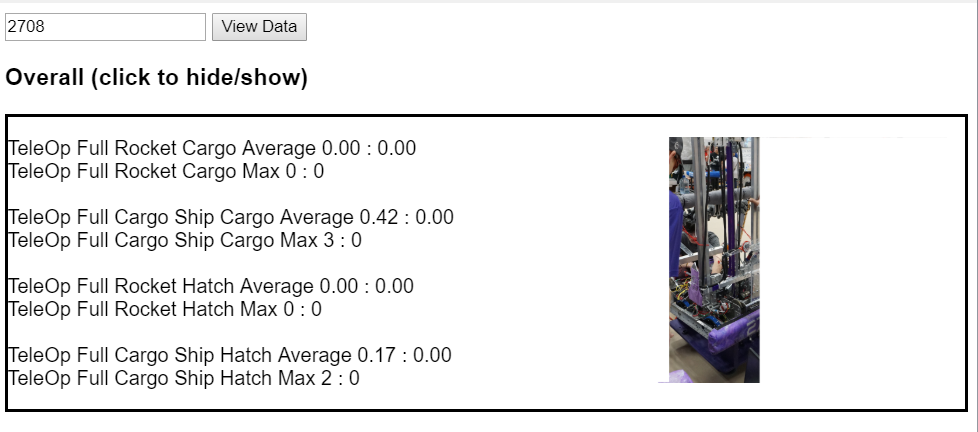
The program shows the average successes and misses of each action that can happen in the game along with the maximum they have completed in all of their matches.
Find maximum:
function getMaxItems(items) {
    //there might be multiple items that are the maximum
    let allMaxItems = [-1];
    for (let i = 0; i < items.length; i++) {
        if (items[i] > allMaxItems[0]) {
            if (items[i] == allMaxItems[0]) {
                //already exists, multiple maximum items
                allMaxItems.push(items[i]);
            } else {
                //set this as the maximum
                allMaxItems = [items[i]];
            }
        }
    }

    return allMaxItems;
}
The program does these summaries while still being able to work with a future data set. It does this by using the labels in each spreadsheet file as the labels it uses to display.
Sandstorm summary
In the sandstorm period, robots usually only do one thing. So, it is possible to condense 27 columns in a spreadsheet to just one line of text.
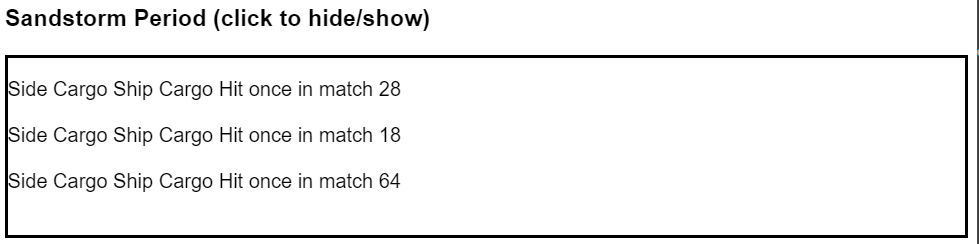
This is a vast improvement in amount of time it takes to read.
Next Steps
- Improving the UI
- Adding nice charts
- Adding more data points to view, such as climbs and comments