
Repository
https://github.com/ajayyy/LakeEffectScoutingSummary
What is this
This is a reader for the scouting app developed for FIRST Robotics Team 2708. It is used to scout other robots at the competition. The data is sent from 6 client apps to the server over bluetooth throughout the course of the events. The server must manage and put everything together. Scouting is necessary to be able to change your team's strategy and know what teams to pick to join your alliance. This reader converts the complicated database information into something easily understandable.
About this year's game
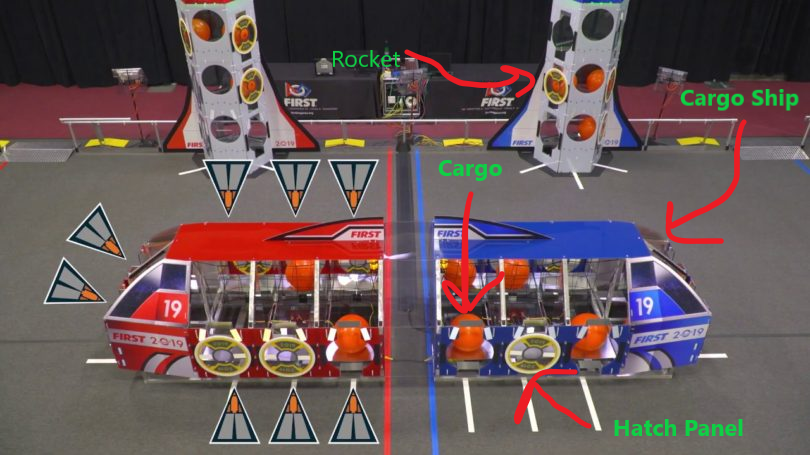
In this years game, teams must score "cargo" into holes in rockets. If the cargo is put in without a hatch panel, then it will fall out. The hatch panels must be fastened on to the rockets and cargo ship to prevent the cargo from falling out.
Big Changes
The reader now works on the web, not just electron. This means I can access the data from any device, even my phone. This makes it much easier to use this data when talking to other robotics teams.
- Reorganised files to make main.js less cluttered.
- Added hidden extra info available on click. Helps with LakeEffectRobotics/LakeEffectScoutingApp#281
- Added clicking cursor on clickable items
This is very nice UX wise, this just makes it so that when you hover over a clickable item, the clicking pointer appears.
It simply uses the cursor: pointer; property.
- Added search functionality to new custom search panel. Also changed some of the single quote strings to double quotes for consistency reasons.
- It receives the labels with ipc.
- Made the search functionality better by switching to onkeyup
- Added ability to select and deselect search terms
- Added a custom info section allowing you to see a table view of the raw data.
- You can select and deselect items, and they will appear/disappear
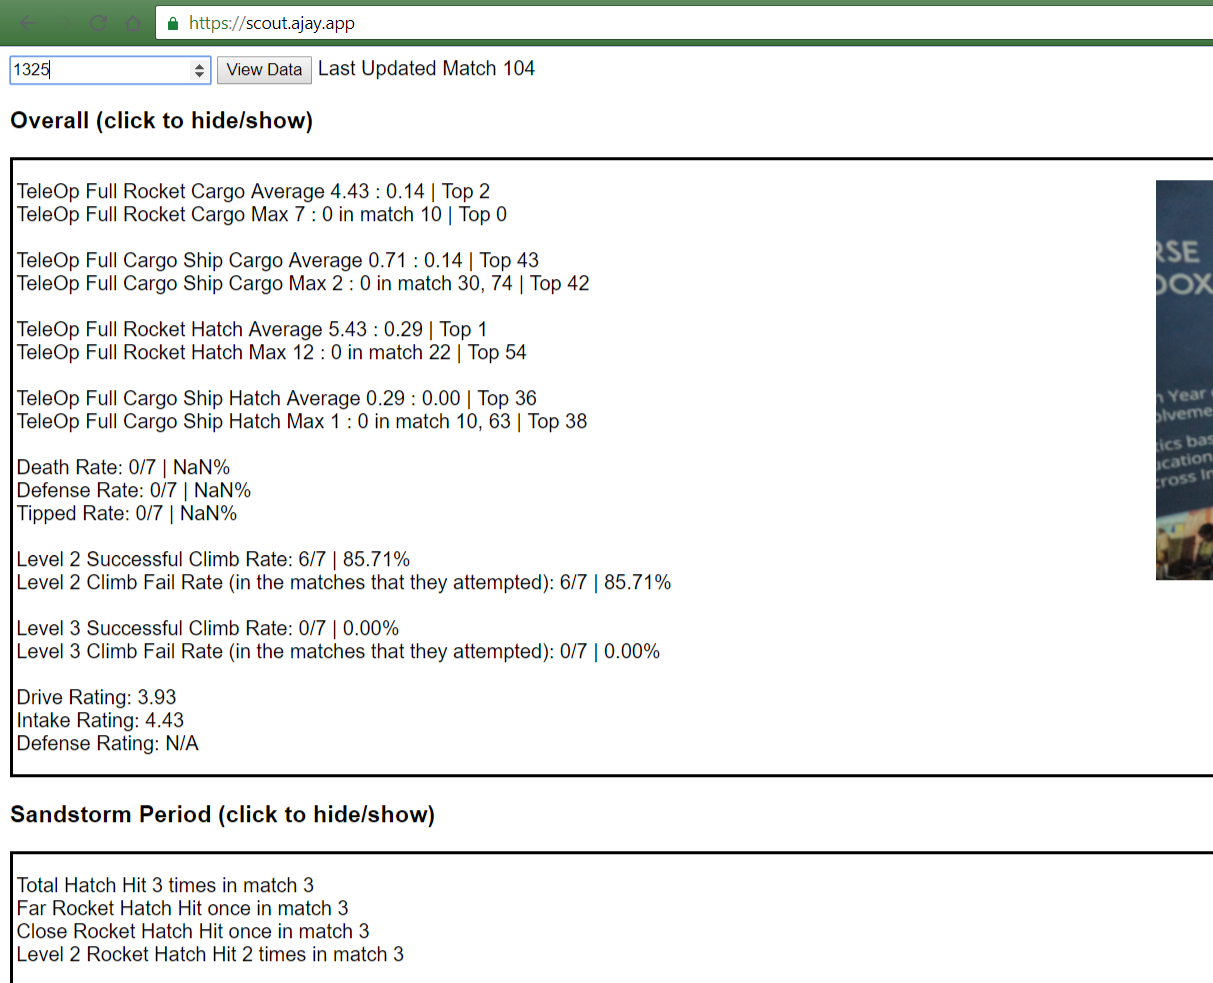
This is the custom summery viewer:
This allows you to see all the raw data for this robot as if you were looking at the spreadsheet in an even easier way. The items close and open when clicking, and you can even search through the data names easily.
- Added what match the maximum performance happened in.
This allows you to see when they peaked. If they peaked in a later match, it's a good sign.

- Added ability to get straight to the raw data when clicking on the summarized data.
- The correct raw data is pulled up and the window automatically scrolls down to the custom data section.
This is a very cool feature. This let's you get to the correct raw data very easily.
- Added ability to get what position a robot is in for averages of statistics.
This is very useful. If a robot can do 5 cycles of hatch for example, it's useful to see how good they are versus the competition. Now the program finds what position they are in and writes "Top X".

This is done using the generateStats function.
//will generate the placement statistics for each robot
//Ex. sorted list of top hatch robots, sorted list of top cargo bots
//sortByAverage: true if sorting by average, false if sorting by max
function generateStats(labels, robots, actionSummaryLabels, sortedRobotsByStat, sortByAverage) {
    //the list of statistics to look at
    let statistics = [];
    for (let i = 0; i < actionSummaryLabels.length; i++) {
        statistics.push(actionSummaryLabels[i] + " Hit");
    }

    for (let i = 0; i < statistics.length; i++) {
        let columnIndex = getColumnIndex(labels, statistics[i]);

        let sortedRobots = [];
        let robotsLeft = Array.from(robots);
        while (robotsLeft.length > 0) {
            //robots performing the best this round
            let bestRobots = [];
            let highestPerformance = -1;

            for (let robotNumber = 0; robotNumber < robotsLeft.length; robotNumber++) {
                let dataPoints = [];
                for (let dataPoint = 1; dataPoint < robotsLeft[robotNumber].data.length; dataPoint++) {
                    //not just an empty line
                    if (robotsLeft[robotNumber].data[dataPoint].length > 1) {
                        dataPoints.push(robotsLeft[robotNumber].data[dataPoint][columnIndex]);
                    }
                }
                let performance = 0;
                if (sortByAverage) {
                    performance = getAverageItem(dataPoints);
                } else {
                    //sort by max otherwise
                    performance = getMaxItems(dataPoints)[0][0];
                }
                let robotIndex = robots.indexOf(robotsLeft[robotNumber]);

                //if it's more, set it to be this robot
                //if it's the same, add this robot to the list (it's a tie)
                if (performance > highestPerformance) {
                    bestRobots = [robotIndex];
                    highestPerformance = performance;
                } else if (performance === highestPerformance) {
                    bestRobots.push(robotIndex);
                }
            }

            //these are the best robots, add them to the list together as they are tied
            sortedRobots.push(bestRobots);

            //remove these robots from robots left
            for (let q = 0; q < bestRobots.length; q++) {
                robotsLeft.splice(robotsLeft.indexOf(robots[bestRobots[q]]), 1);
            }
        }
        sortedRobotsByStat[i] = sortedRobots;
    }
}
This sorted data is then checked through later when making the summaries.
let averageStanding = getPositionInSortedList(robots, averageSortedRobotsByStat, currentRobotNumber, searchTermIndex);
    fullSummary += " | Top " + averageStanding + "<br/>";
function getPositionInSortedList(robots, sortedRobotsByStat, robotNumber, statIndex) {
let position = 0;
//find robot index from robot number
let robotIndex = 0;
for (let i = 0; i < robots.length; i++) {
if (robots[i].robotNumber === robotNumber) {
robotIndex = i;
}
}
for (let i = 0; i < sortedRobotsByStat[statIndex].length; i++) {
if (!sortedRobotsByStat[statIndex][i].includes(robotIndex)) {
position += sortedRobotsByStat[statIndex][i].length;
} else {
//the robot has been found
break;
}
}
return position;
}- Created the first server version of the reader. This version runs on a server and passes the data over https calls.
This is the most useful update. Now, the whole program works using api calls. All the normal data is recieved in json by using api calls such as https://scout.ajay.app/getLastUpdated.
The html files now check if node is installed before choosing to use API calls or RPC (electron's communication method).
Almost all calculations are done server-side to not drain the client's battery.
- Added scouting data uploading system to the server
To make it easier to get updated data on the site throughout the day, a data uploading page was added.
It takes data uploaded and reloads all the data in the program.
It will only upload data if the correct password is inputted to prevent spam and sends the user to an "Upload Failed" page if an issue happened.
function upload(req, res, fileType, folder) {
    try {
        var form = new formidable.IncomingForm();
        form.maxFileSize = 1000 * 1024 * 1024 * 1024;

        let files = [];
        let field;

        form.on('field', function(fieldName, value) {
            if (fieldName == "password") {
                field = value;
            }
        });

        form.on('file', function(field, file) {
            files.push(file);
        });

        form.on('end', function() {
            let success = false;
            for (let i = 0; i < files.length; i++) {
                if (field == loadedPassword && files[i].name.endsWith(fileType)) {
                    try {
                        fs.copyFile(files[i].path, __dirname + folder + files[i].name, function(err) {
                            if (err) {
                                console.error(err);
                            }

                            if (folder == "/data/" && i == files.length - 1) {
                                //then reload the data
                                setTimeout(loadData, 3000);
                            }
                        });

                        success = true;
                    } catch (err) {
                        console.log(err);
                        success = false;
                    }
                }
            }

            if (success) {
                res.redirect("success");
            } else {
                res.redirect("failed");
            }
        });

        form.parse(req);
    } catch(err) {
        console.log(err);
        res.redirect("failed");
    }
}
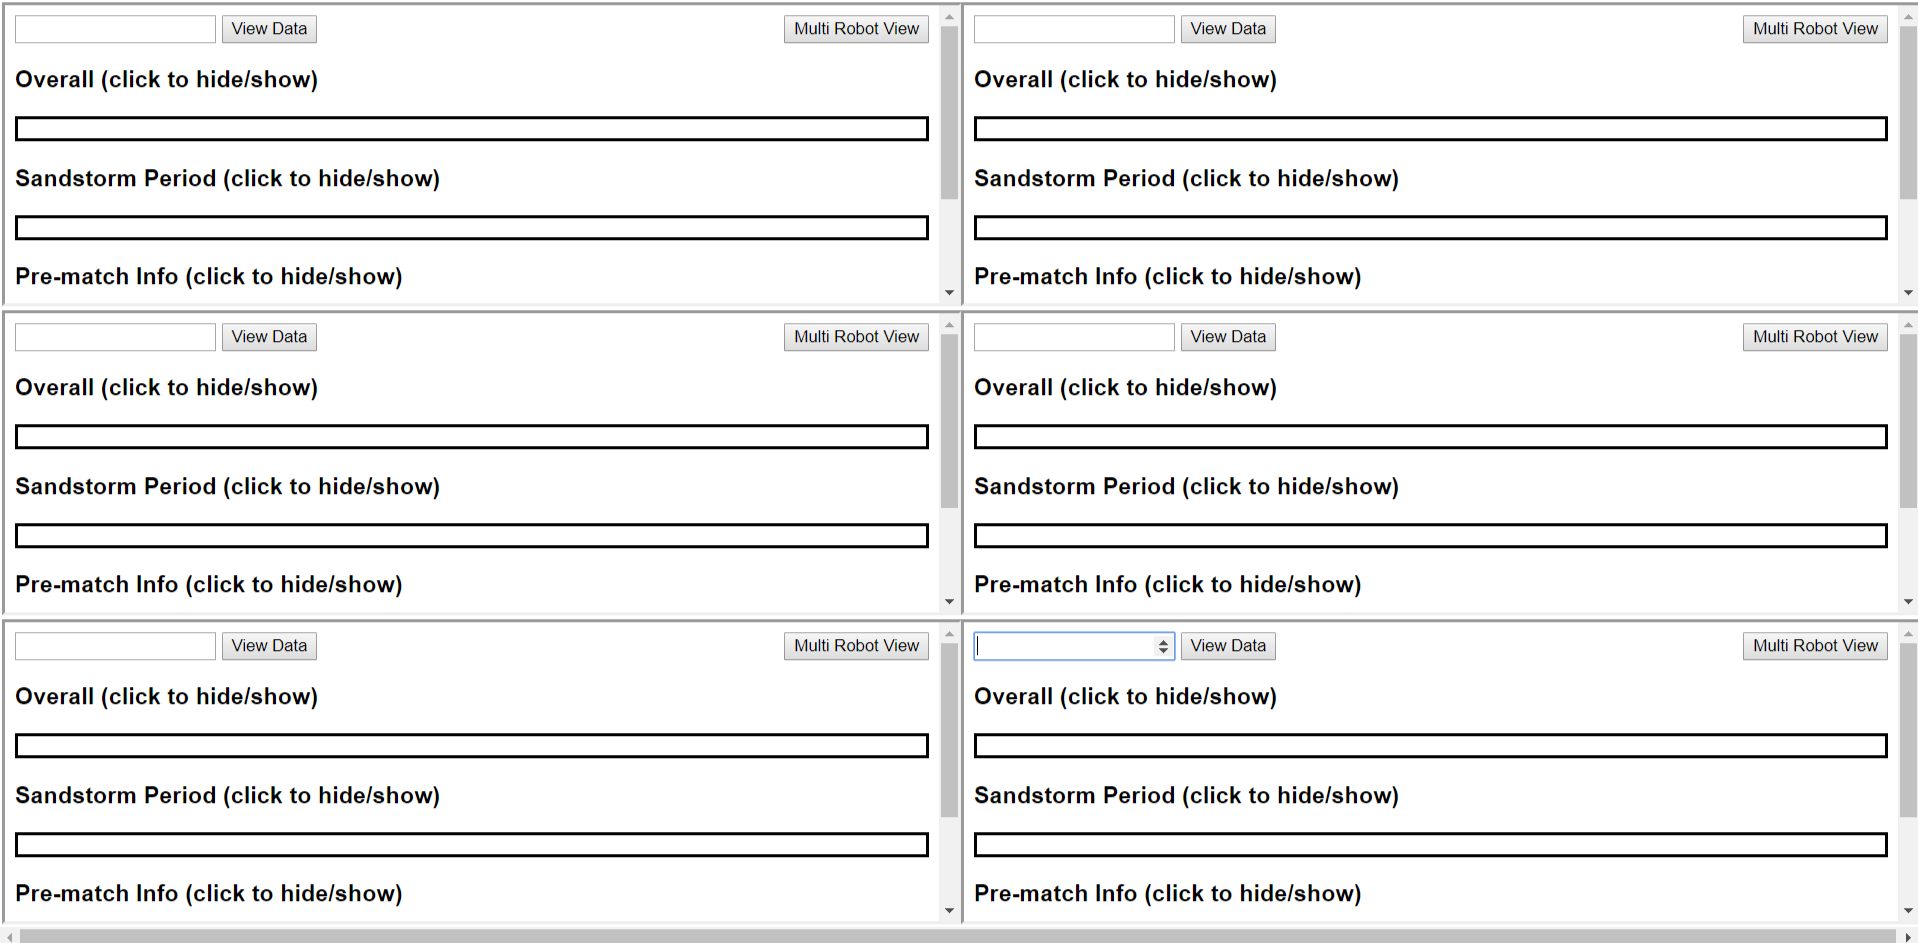
- Added a multi view page
This page features 6 versions of the website. Since this competition has matches with 3 robots against another 3 robots, this allows strategic planning to happen quickly.
- Made the desktop app be able to pull periodically from the server
Having a constant internet connection at the competition is rare. So, I added a feature to allow the desktop program to let you pull data from the server when you are on an internet connection. You can the use this data when you are offline, making you not 100% reliant on the server, but still get the latest robot data updates.
- Made the window title contain the robot number
This is a nice feature since it let's you see which tab is for which robot when opening multiple tabs to compare data.
Pull Requests
https://github.com/ajayyy/LakeEffectScoutingSummary/pull/3 https://github.com/ajayyy/LakeEffectScoutingSummary/pull/4 https://github.com/ajayyy/LakeEffectScoutingSummary/pull/5